SuperCam LIBS composition data
mission specific
Chemical composition results derived from archived data by the Mars 2020 SuperCam team have been added to the Notebook. These results are not archived products themselves but are included in the Notebook as supplementary material. Each composition is associated with a target.
Data description
SuperCam LIBS elemental abundances
SuperCam uses laser-induced breakdown spectroscopy (LIBS) to obtain semi-quantitative elemental abundances from rasters of small observation points 300–600 μm in diameter at distances of 2-7 m. Results are currently obtained for oxides of the major elements: SiO2, TiO2, Al2O3, FeOT (total iron content assessed as FeO), MgO, CaO, Na2O, K2O, and the totals of these elements, all given as weight percent (wt%). Quantitative chemistry is based on multivariate statistical models trained on data collected in the laboratory.
The LIBS elemental abundances are stored in a csv file named supercam_libs_moc.csv and is located in the data_derived_spectra collection. The table of results is organized with each average spectrum as a row, and abundances of each major element oxide as columns. An additional column for each major element contains the standard deviation of the derived abundances of that element for each of the individual laser shots on that location. This standard deviation helps to identify points with increased variation between shots, which may indicate changes in composition with laser ablation depth. Above the results, the Minimum, First quartile, Median, Third quartile, and Maximum value of the training set for each major element oxide are listed. These are useful for evaluating whether a derived composition exceeds the range over which the multivariate model is expected to be reliable. It is the nature of many multivariate models that they do not extrapolate beyond the training set range very well, so an abundance approaching or exceeding the training set maximum value may indicate a higher true composition. The best estimate of the accuracy is the RMSEP; this is listed above the abundances of each major element oxide. At the right-hand side of the table, the "Total" column lists the sum of major element oxides. The abundances are not normalized to 100 wt.%, so this value can vary. Low totals can indicate that a target contains significant amounts of un-quantified elements (e.g. sulfur, hydrogen, etc.) A final column lists the total emission of the spectrum prior to normalization. This can be used to assess the quality of the spectrum: low signal may indicate a poor-quality spectrum (though users should visually inspect spectra as well).
Derived composition data
Laboratory data are masked to remove noisy portions of the spectra, and then the values from each spectrometer are normalized to the total signal from the spectrometer, so that the full spectrum sums to 5. In some cases, "peak binning" is applied prior to normalization. This binning uses the average training set spectrum to define local minima and maxima, and then each individual spectrum is summed between local minima, with the resulting values assigned the wavelength of the corresponding local maximum. This reduces the size of the spectra, consolidates signal from weak/broad lines, and increases robustness to wavelength shifts. In some cases, the spectra are also standardized: each spectral channel is mean-centered and scaled by the standard deviation. This reduces the influence of the strongest lines and amplifies the influence of weaker lines, resulting in improved results in some cases.
For each major element, the laboratory data were subdivided into five folds, with similar distribution of compositions ensured by sorting on the composition of interest prior to fold assignment. All spectra of the same target were included in the same fold. One fold was held out as an independent test set, the remaining four folds were used for model cross validation and optimization. A variety of multivariate regression models were evaluated, including Ordinary Least Squares (OLS), Partial Least Squares (PLS), Least Absolute Shrinkage and Selection Operator (LASSO), Orthogonal Matching Pursuit (OMP), Least Angle Regression (LARS), Support Vector Regression (SVR), Elastic Net, Gradient Boosting Regression (GBR), Random Forest Regression (RF). All of these methods were implemented using the scikit-learn library. In addition, Local Elastic Net and blended submodel regression were used. These methods were implemented via the Python Hyperspectral Analysis Tool (PyHAT). Each model was optimized by selecting the parameters that minimized the Root Mean Squared Error of Cross Validation (RMSECV). Final models were then chosen based on the accuracy when predicting the independent test set (Root Mean Squared Error of Prediction; RMSEP), as well as performance when obtaining the derived abundances of the SuperCam calibration targets, and through assessment of initial abundances of Mars targets.
For SiO2, the derived abundances are an average of the results of GBR and PLS models. For TiO2, RF was the most accurate model. For Al2O3, the reported compositions are an average of the abundances derived from RF, two different implementations of PLS, and Local Elastic Net. For FeOT and CaO, RF was the most accurate model. For MgO and Na2O, GBR was the most accurate model. For K2O, the reported compositions are an average of Elastic Net, SVR, Local Elastic Net, LASSO, and PLS results.
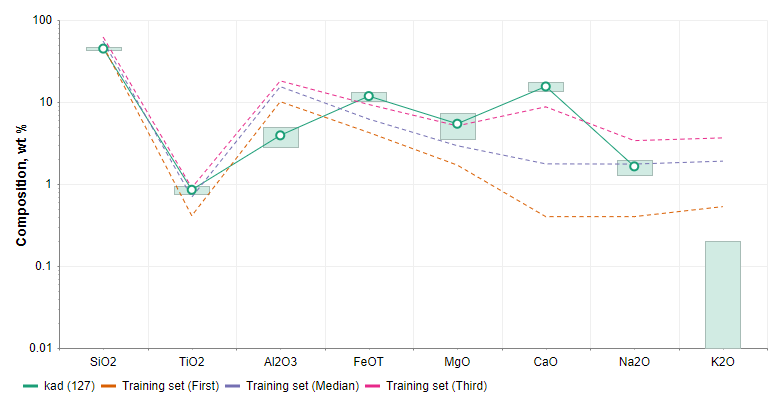
Data viewer
A plot of composition data is shown when viewing SuperCam LIBS products in the Notebook. The median and first and third quartile training set values are shown in addition to composition values derived for the observation.
Exporting the chart and data
The composition plot can be exported as an image or PDF using the Export menu above the chart. In addition, all LIBS MOC data and companion PDS4 label can be exported from the same menu.